The Sustainability Studies program is offering an exciting new course in Fall 2018 on Geographic Information Science (GIS). GIS is a software application that allows us to visual data, ask questions, and conduct analysis so that we can better understand relationships and patterns in our world. Everything is geographical – literally everything happens somewhere. This means that GIS is used in every field, from businesses trying to figure out the best new location for a new store, to public health officials trying to identify patterns in the spreading of disease, to conservationists looking to map critical resources for protection. And of course, many of the apps on your smart phone are using and producing geographic data that help us in our daily lives! Perhaps most importantly for RU students, job growth for folks with GIS skills is predicted to be higher than the national average.
Students in the course will be exposed to the rapidly growing world of spatial analysis and cartography using the industry’s leading software tool, ArcGIS. Through a combination of lecture and hands-on work in a state-of-the-art computer lab, we’ll learn
- about the types of geographic data and the theories underlying GIS
- the principles of cartography (scale, resolution, projection, etc)
- how to store, analyze and interpret spatial data
- how to make maps
- how to apply GIS to create apps
Because this is a course in the Sustainability Studies program, the majority of our GIS applications will focus on environmental and social questions. However, students will have the opportunity to develop their own GIS projects, so students from all fields are welcome in the course.
As an example of how GIS works, consider the following image:
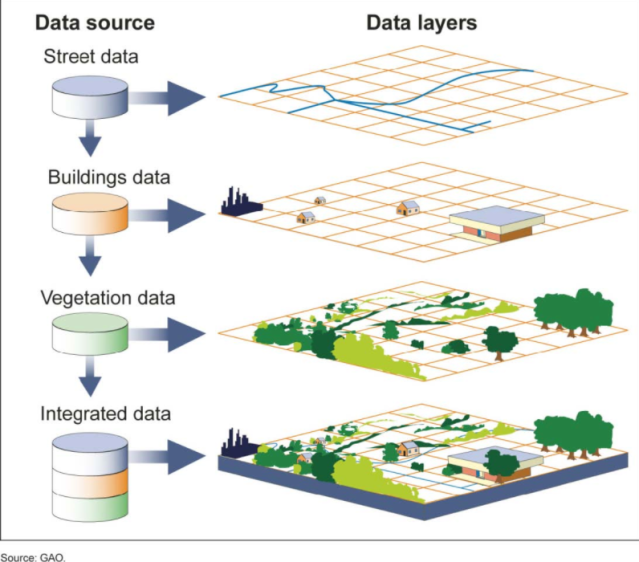
Data from different sources (layers) can be combined so that specific questions can be asked about their relationships. Let’s say we wanted to identify a suitable location for a new park in the city of Los Angeles. We could combine data about population characteristics, land use, and the presence of toxic releases and then use GIS analysis tools to refine our search. Consider the image below, which shows a screenshot from an ArcGIS project on ESRI’s website that deals with this question:
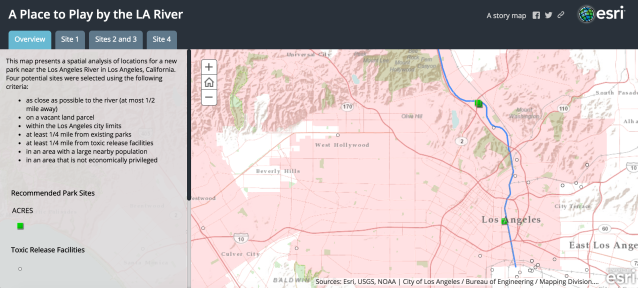
The green squares indicate places where a park would serve an underprivileged area using vacant land that is far from toxic releases. The ability to inform land use decision-making is just one of the many useful applications of GIS that we will engage with in the course.
Course Registration Information
- Title/number: SUST 390 Introduction to GIS (section 01)
- Semester offered: Fall 2018
- Location: Auditorium Building, Room 1011
- Day/time: Monday lecture 11-11:50, Wednesday lab 11-1pm
- Start date: 30 Aug 2018
- Lab fee: $25
- Pre-req: Undergraduate level ENG 102 Minimum Grade of C-

Cool! Wish they had it when I was in school. At my age you don’t take “Introduction to … (whatever).” You take “Out-roduction to …”